Once test execution is complete, we use the Analyzer component to compile the raw logs. Analysis correlates multiple graphs to identify the exact cause of performance bottlenecks.
What is Analysis?
The Analyzer compiles raw logs from all components (Controller, Agents, Monitors) and presents consolidated graphs and reports. This helps us correlate system behavior and pinpoint performance bottlenecks.
Key Objectives
- Identify performance bottlenecks and root cause
- Correlate multiple metrics on the same timeline
- Understand system behavior under load
- Provide actionable insights for optimization
Correlating Graphs
To locate issues, overlay multiple metric graphs on a single timeline:
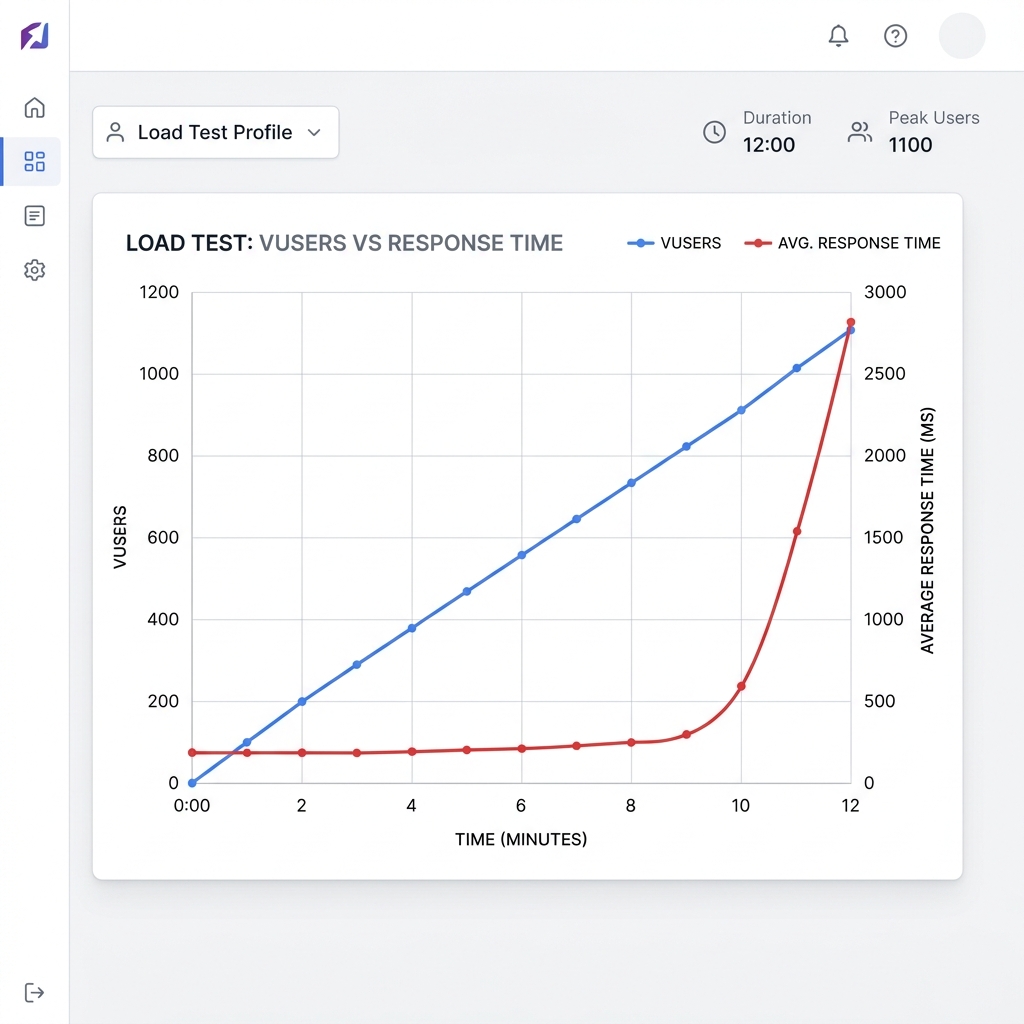
Vusers vs Response Time
If response times increase as Vusers ramp up, the system has scalability limits.
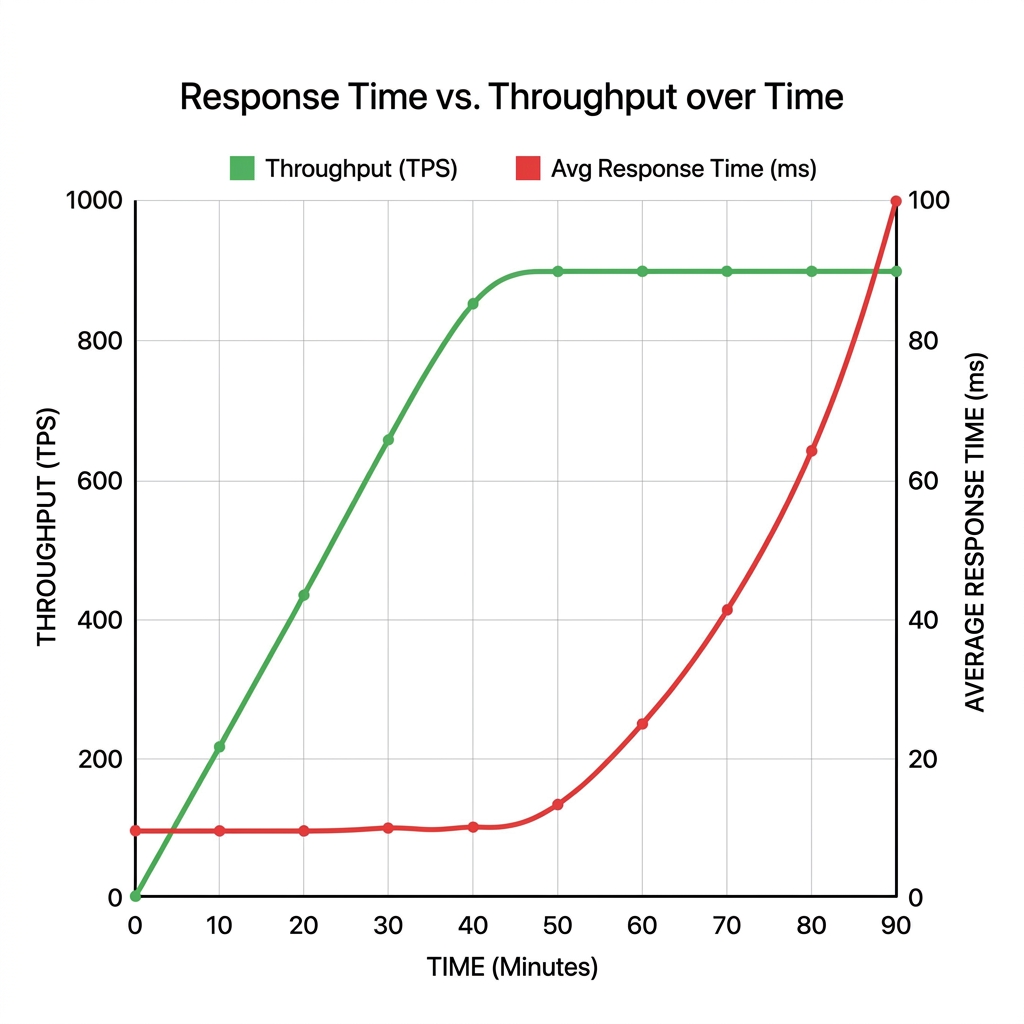
Response Time vs Throughput (TPS)
If throughput stops growing (flattens) while response times increase, a resource bottleneck (thread, CPU, or DB lock) has been reached.
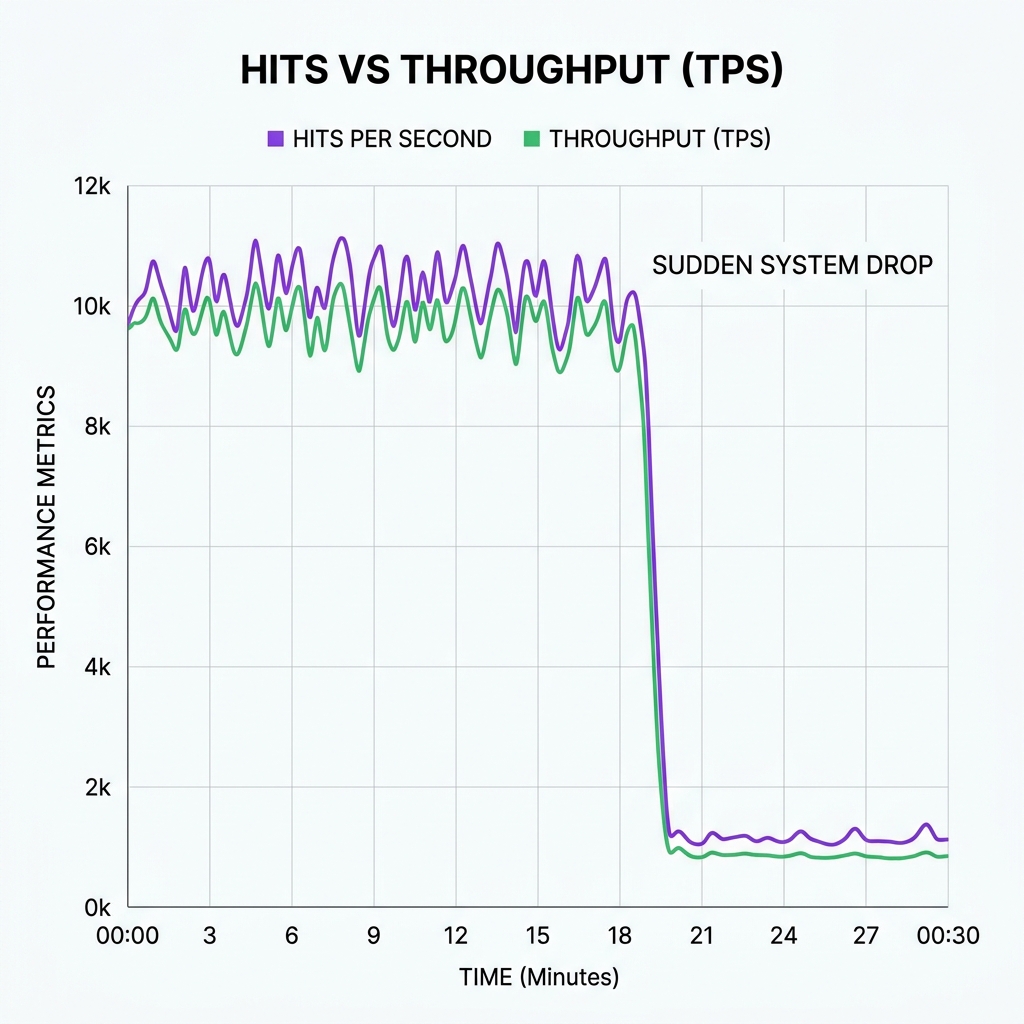
Hits vs Throughput
A drop in hits per second accompanied by throughput drops indicates server connection dropping or crashes.
Bottleneck Definition
A bottleneck is a restriction point that limits the flow of data. Common bottlenecks include slow SQL queries, CPU saturation, and thread locking.
Slow SQL Queries
Queries taking high execution time or causing frequent locks and waits.
CPU Saturation
CPU usage consistently close to 100%.
Thread Locking / Contention
Threads waiting for locks, semaphores, or other resources.
Memory Pressure
High memory usage, frequent GC, or swapping.
Analysis Workflow
Import Results
Import raw logs from Controller and Monitors into Analyzer.
Review Dashboard
Summary dashboard for key metrics and health.
Correlate Graphs
Overlay and correlate multiple metrics to identify issues.
Drill Down
Drill down to transactions, queries, threads, and resources.
Identify & Report
Identify root cause, document findings, and recommend fixes.