Defect analysis investigates performance issues to isolate their root causes.
What is Defect Analysis?
Defect analysis is the process of investigating performance issues observed during load testing to identify the underlying root cause. It combines evidence from multiple metrics, logs, and system behavior.
Objectives
- Identify performance defects and their symptoms
- Analyze and correlate metrics to find root causes
- Provide actionable recommendations to fix the issues
- Prevent defect recurrence through tuning and monitoring
Common Performance Defects
| Defect | Symptom | Common Root Cause |
|---|---|---|
|
Response Time Degradation
|
Average response times increase continuously during steady state. |
|
|
Memory Leak
|
Memory utilization grows continuously and never returns to baseline after load. |
|
|
Database Lock
|
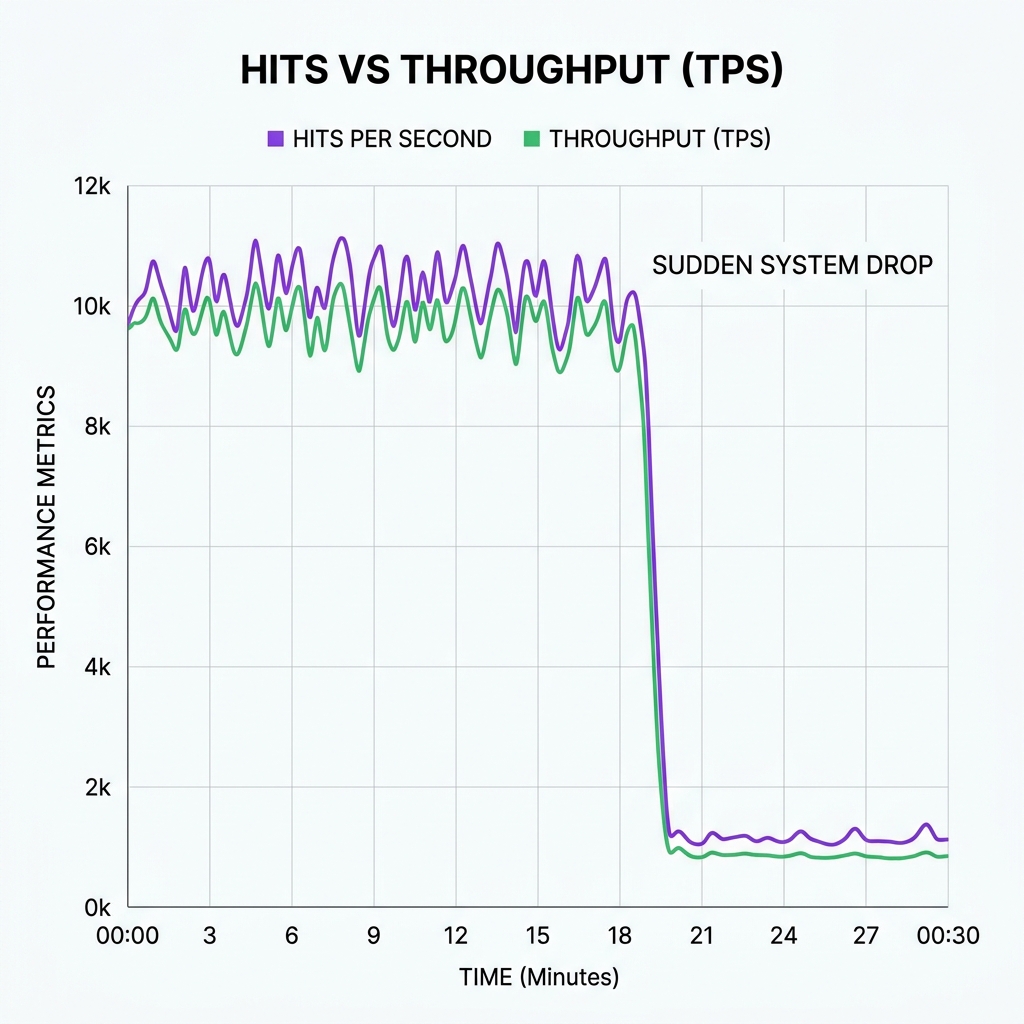
Throughput drops to zero and requests timeout. |
|
Defect Analysis Workflow
Identify abnormal behavior in graphs, logs, or reports.
Correlate multiple metrics on the same timeline.
Drill down to find the exact root cause.
Confirm the cause with additional tests or logs.
Apply fix, re-run test, and verify improvement.
Defect Details & Analysis
Response Time Degradation
Memory Leak
Database Lock
Symptom
Average response times increase continuously during steady state.
Impact
Poor user experience, SLA violations, system throughput reduces.
How to Detect
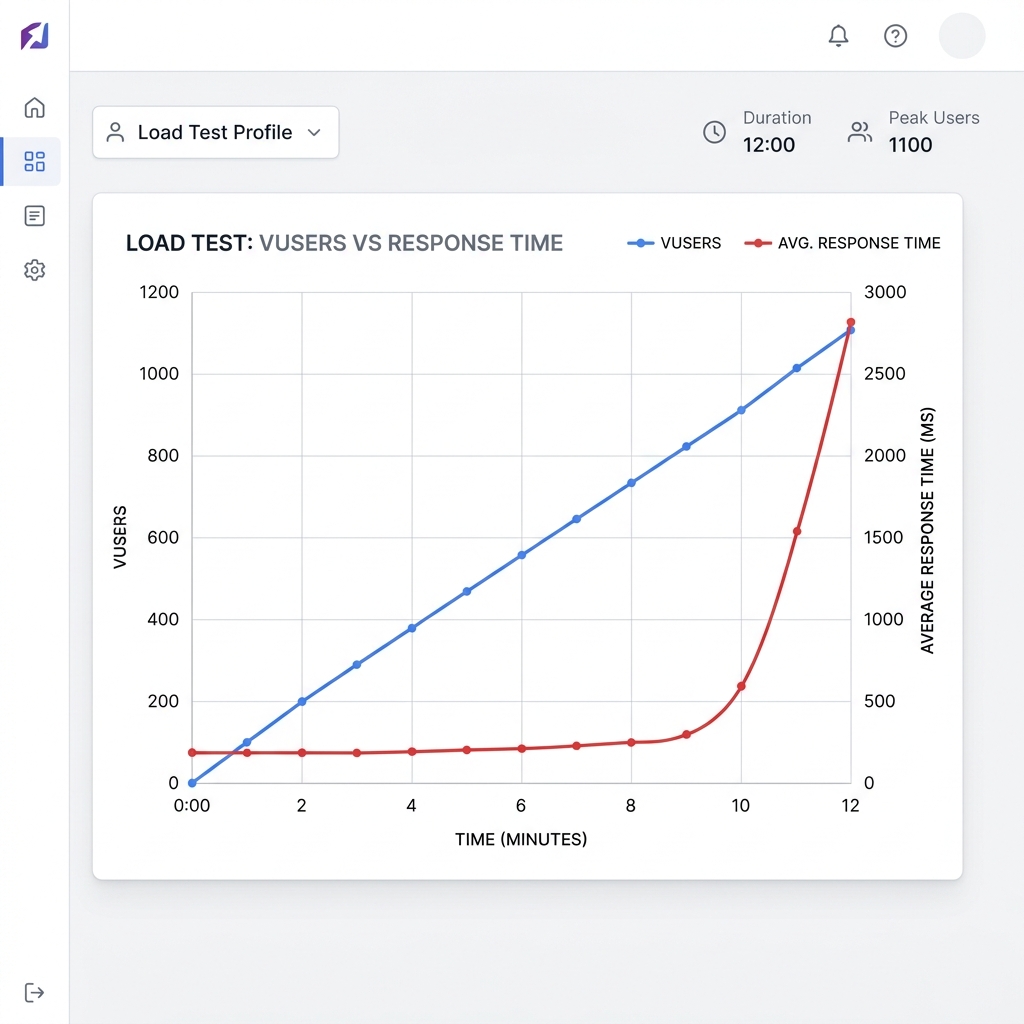
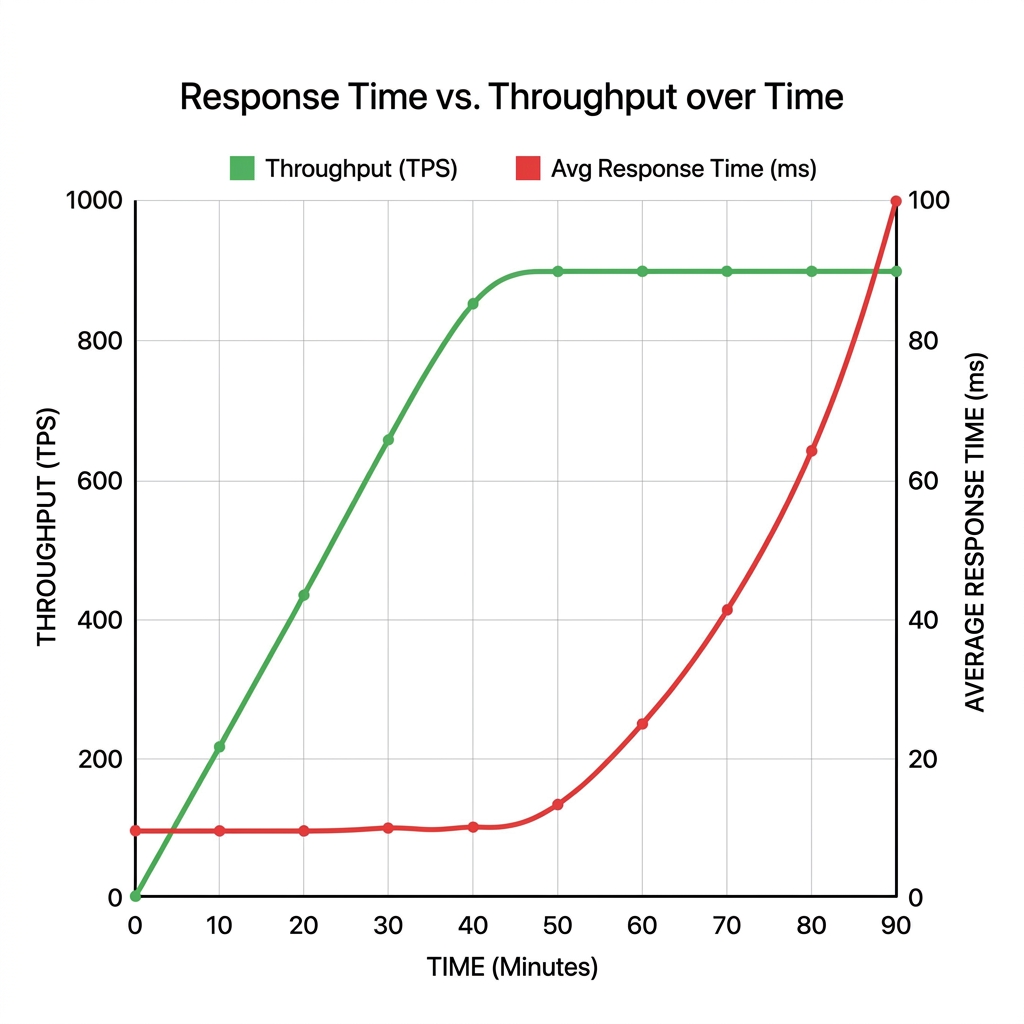
Overlay Users vs Response Time and Throughput vs Response Time graphs.
Example Analysis
Root Cause Indicators
- Response time increases as users increase.
- Throughput plateaus while response time continues to rise.
- CPU, DB, or thread pool utilization near 100%.
Common Root Causes
- Thread pool exhaustion causing request queuing.
- Slow database queries or missing indexes.
- High CPU or GC activity.
Recommendations
- Increase thread pool size.
- Optimize slow SQL queries and add indexes.
- Scale up CPU/RAM or distribute load.
Tools to Analyze Defects
JMeter
- View Summary Report, Aggregate Report.
- Analyze graphs with Backend Listener.
- Use JMXMon / PerfMon for system metrics.
NeoLoad
- Use Monitor & Results.
- Drill down by transaction.
- Correlate KPIs with server metrics.
LoadRunner
- Use Analysis and Diagnostics.
- Correlate Controller, Agent, and Server metrics.
- Identify bottlenecks in graphs.
Common Artifacts
- Logs (Application, Server, DB).
- Performance graphs.
- System/Infra metrics.
- Configuration & code review.
- logs/ app.log
- results/ server.log
- screenshots/ db.log
- config/ graphs.png
Tip: Always correlate multiple metrics and validate with logs before concluding the root cause.