Reporting communicates the test findings to project managers, developers, and stakeholders. A premium report should summarize findings in both business and technical terms.
What is Reporting?
Reporting presents the performance test results in a clear and actionable format. It helps all stakeholders understand the application performance and make data-driven decisions.
Primary Components of a Report
- Executive Summary: High-level pass/fail summary and recommendations.
- SLA Compliance Table: Comparison of average response times against target SLAs under load.
- System Statistics: Maximum TPS achieved, error rates, and peak resource utilization.
Recommendations
A good report doesn't just state "the application is slow." It should suggest tuning actions, such as adding indexes to database tables, increasing connection pool sizes, or scaling up server CPU/RAM.
Executive Summary
Overall Result
PASSED
Test Objective Achieved
Max Users (Concurrent)
1,000
Target: 1,000 Users
Max Throughput (TPS)
2,850
Transactions Per Second
Avg Response Time
1,236 ms
Target: ≤ 2,000 ms
Error Rate
0.35 %
Target: ≤ 1%
Test Duration
01:00:00
hh:mm:ss
SLA Compliance (Average Response Time)
| Transaction / Page | SLA Target (ms) | Average (ms) | 90th Percentile (ms) | 95th Percentile (ms) | SLA Status |
|---|---|---|---|---|---|
| Login | 1000 | 620 | 890 | 980 | PASS |
| Search Products | 2000 | 1250 | 1750 | 1950 | PASS |
| Add to Cart | 1500 | 980 | 1420 | 1480 | PASS |
| Checkout | 3000 | 2280 | 2860 | 2980 | PASS |
| Payment Gateway | 5000 | 3420 | 4820 | 4980 | PASS |
| Order Confirmation | 2000 | 1160 | 1650 | 1880 | PASS |
All key transactions are within the defined SLA targets under the tested load.
System Statistics
Performance Metrics
Maximum Throughput (TPS) 2,850
Average Throughput (TPS) 2,210
Total Requests 10,26,530
Successful Requests (%) 99.65 %
Error Requests (%) 0.35 %
Resource Utilization (Peak)
CPU Utilization 82 %
Memory Utilization 78 %
Disk Utilization 65 %
Network Utilization 68 %
JVM Heap Utilization 72 %
Test Configuration
Tool Used JMeter 5.6.3
Test Type Load Test
Engine Distributed
Load Pattern Step Up
Total Duration 60 Minutes
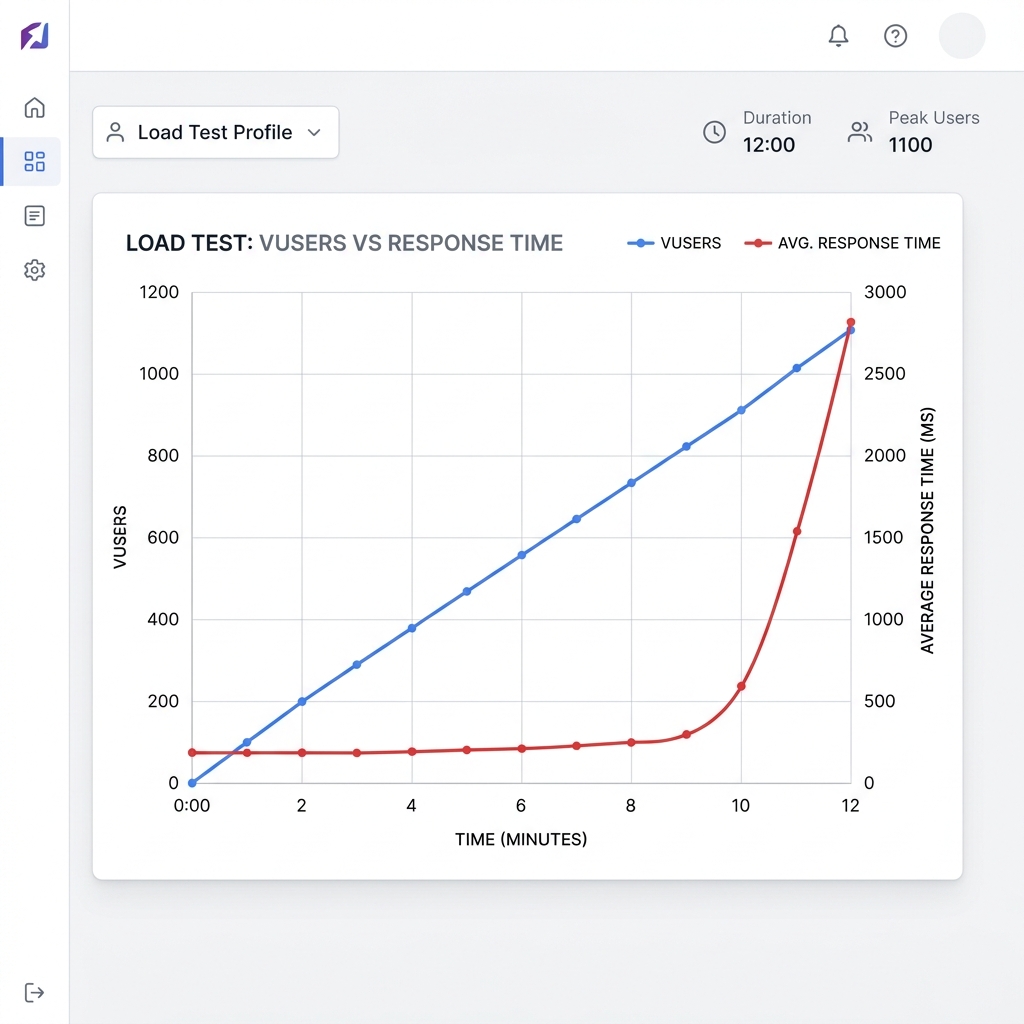
Users vs Response Time
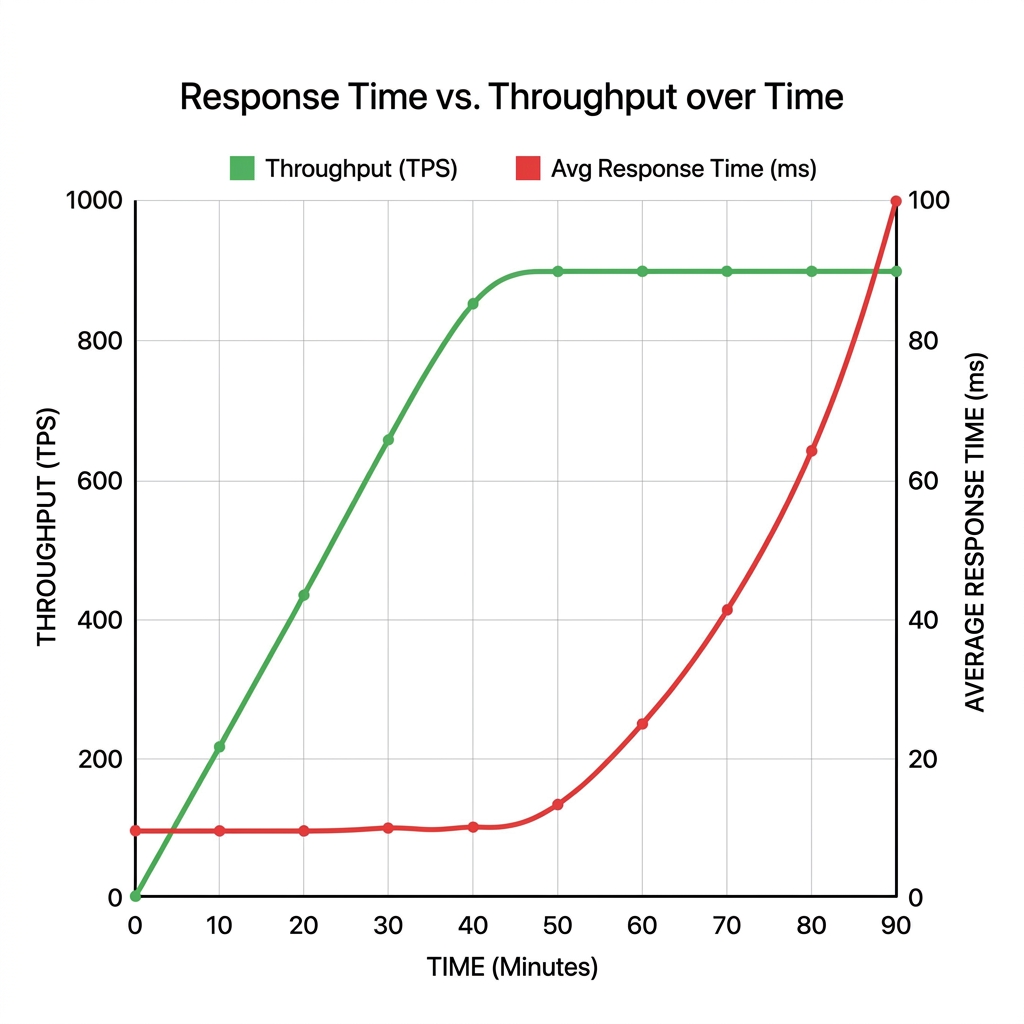
Throughput (TPS)
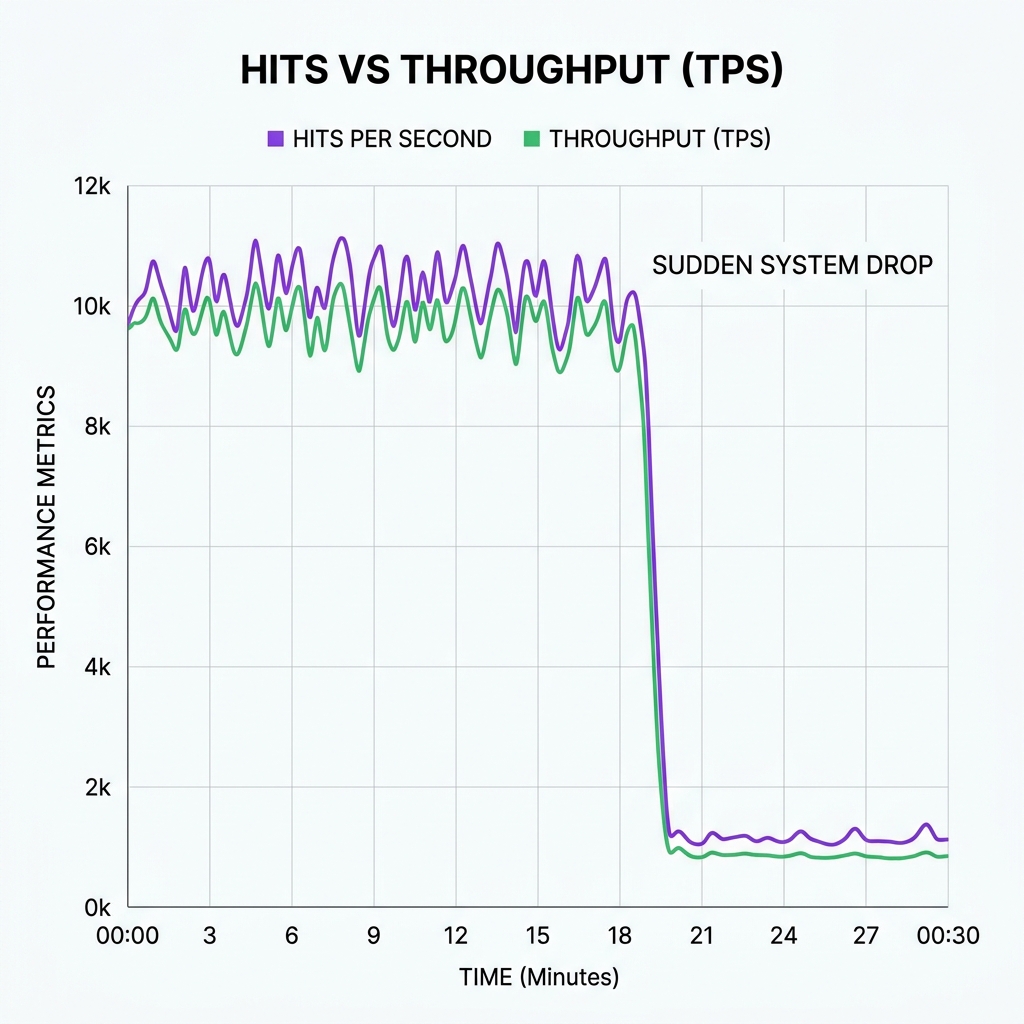
Error Rate (%)
Recommendations
- Database: Add indexes on frequently used search columns to improve query performance.
- Connection Pool: Increase database connection pool size from 50 to 100.
- Application Server: Increase JVM heap size to 4GB for better memory handling.
- Infrastructure: Scale up CPU to 8 cores and ensure SSD storage for better I/O performance.
- Code Optimization: Optimize slow APIs and reduce external service calls.
How to Generate Reports
JMeter - Generate Report
- Run the test and save the .jtl file.
- Open Command Prompt/Terminal.
- Run the command: jmeter -g results.jtl -o ReportFolder
- Open ReportFolder/index.html in browser.
LoadRunner - Generate Report
- After test execution, open Analysis tool.
- Click File > Generate Report.
- Select the analysis results (.lrr).
- Choose report template and save.
NeoLoad - Generate Report
- After test execution, open NeoLoad Controller.
- Go to Results > Reports.
- Select report template.
- Generate and export (HTML/PDF/Excel).
Tip: Always attach raw results along with the report for transparency and future analysis.